Beyond pretraining then posttraining: an exploration of interleaving NTP and RL
Experiments in chess and math track pretraining loss, intermediate gains, and what survives final reinforcement learning.
Pretraining and reinforcement learning optimize different objectives. Pretraining rewards predicting the training data; RL rewards successful behavior on a task. A natural question is whether alternating them can make the two stages work better together.
We studied this in chess, first through a broad set of continuation and trace-training experiments, then through a second study with different rollout settings and RL data schedules. We also tested the main approaches in math.
We have not found a consistent improvement in final task performance from interleaving. But the intermediate checkpoints are informative: an approach can improve pretraining loss, retain more single-attempt success, or solve more problems within sixteen attempts without improving all three. Some of these gains also disappear by the end of final RL.
We organize the experiments around two questions:
- Does inserting RL help the subsequent pretraining stage?
- After all training is complete, is the model better than ordinary pretraining followed by RL?
What we compare
Our conventional baseline completes pretraining and then runs 3,000 RL updates. The interleaved PT experiments divide pretraining into two halves and place 1,500 RL updates between them, followed by another 1,500 RL updates at the end. Trace-only experiments complete pretraining before the first RL stage, then insert training on successful RL trajectories between the two RL stages.
There are two ways to transfer information from RL into supervised training. We can continue from the RL weights, or we can train on traces generated during RL. These choices can be combined. A trace-training stage can also restart from the earlier PT checkpoint, in which case the traces carry the information from RL while the RL weights are discarded.
| Study | Model / PT budget | RL prompts × samples per update | RL data schedule |
|---|---|---|---|
| Earlier chess | 47M parameters / 5B PT tokens | 256 × 8 | Main final comparison: 28,419 prompts |
| Later chess | 47M parameters / 5B PT tokens | 64 × 16 | Full/full or disjoint A/B |
| Math | OLMo2 1B / 45B PT tokens | 64 × 16 | Full dataset for the three approaches reported here |
Throughout the post, “PT” includes the ordinary supervised task data used by the experiment: chess SFT or math CoT data. Successful RL traces are additional data. Equal PT-token budgets and equal RL-update counts therefore do not make these comparisons equal in total compute.
We report held-out PT cross-entropy, or log loss, with lower values better. We also report sampled pass@k: the probability estimate of solving a problem in k attempts under the evaluation protocol. Pass@1 measures single-attempt success; pass@16 measures success within sixteen attempts. Neither should stand in for the other.
First chess study: what survives the return to PT?
We began with a broad investigation of the boundary between RL and pretraining. Beyond the conventional baseline, we tested two successive PT schedules without intervening RL; training on shuffled or chronological traces; traces followed by PT; traces mixed with PT; and direct continuation from RL weights. We also tested late trace replay and different choices for retaining or resetting AdamW state.
The split-PT control matters. Dividing PT into two schedules can itself change the result. Comparing an interleaved run only with one uninterrupted PT schedule would not isolate the contribution of RL.
Consider the direct-continuation experiment with fresh AdamW. It starts from 2.5B PT tokens, runs RL, and then trains on the remaining 2.5B PT tokens without adding RL traces. Before final RL, its results are:
| Checkpoint | PT loss ↓ | Pass@1 (%) | Pass@2 (%) | Pass@4 (%) | Pass@8 (%) | Pass@16 (%) |
|---|---|---|---|---|---|---|
| After first RL | 0.540289 | 30.79 | 36.39 | 41.26 | 45.60 | 49.53 |
| After direct PT2 | 0.507826 | 17.85 | 27.68 | 38.27 | 47.86 | 55.68 |
| One 5B PT schedule, no RL | 0.512429 | 19.11 | 29.06 | 39.58 | 49.21 | 57.30 |
| Two 2.5B PT schedules, no RL | 0.507432 | 18.23 | 28.09 | 38.71 | 48.62 | 57.43 |
Returning to PT reduces pass@1 from 30.79% to 17.85%, a loss of 12.94 percentage points. At the same time, PT loss improves from 0.540289 to 0.507826, and pass@16 rises from 49.53% to 55.68%.
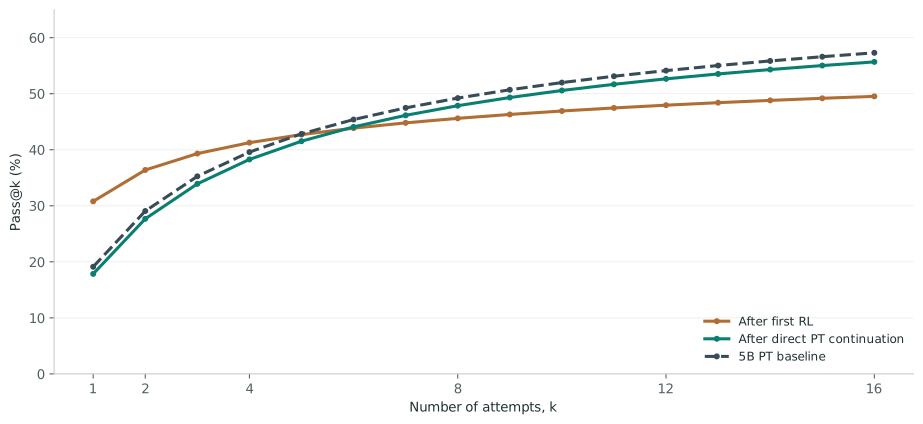
It would be too broad to say that PT erases all of the RL improvement. The low-k and high-k results move in different directions. The supported observation is that direct PT continuation substantially reduces the preceding RL checkpoint’s single-attempt success while improving its PT loss and success within sixteen attempts.
Does RL make the subsequent PT endpoint better? This example does not establish that. Direct continuation has slightly lower loss than the single-schedule 5B baseline, but the split-PT control without intervening RL already has slightly lower loss still: 0.507432 versus 0.507826. Direct continuation also ends below both PT controls at the displayed pass@k values.
What changes when we include the traces?
Adding successful trajectories gives a different intermediate result. We tested both trace training from PT weights and PT-plus-trace training from RL weights.
| Checkpoint | PT loss ↓ | Pass@1 (%) | Pass@2 (%) | Pass@4 (%) | Pass@8 (%) | Pass@16 (%) |
|---|---|---|---|---|---|---|
| 5B PT baseline | 0.512429 | 19.11 | 29.06 | 39.58 | 49.21 | 57.30 |
| Trace-only; reset to PT weights | 0.546131 | 37.70 | 43.32 | 47.97 | 52.03 | 55.88 |
| PT + traces; reset to PT weights | 0.510979 | 33.50 | 40.03 | 45.52 | 50.45 | 55.00 |
| RL weights + PT + all traces; carry AdamW | 0.511704 | 34.08 | 40.40 | 45.72 | 50.67 | 55.61 |
| RL weights + PT + all traces; fresh AdamW | 0.510470 | 34.04 | 40.55 | 45.99 | 50.95 | 55.41 |
These trace-trained checkpoints have much higher observed pass@1 than the ordinary PT baseline. Their pass@16 values, however, are lower. Continuing RL weights with all successful traces reaches roughly 34% pass@1 before final RL, compared with 17.85% for direct PT continuation without traces. This is evidence that the tested recipes produce different intermediate behavior; the optimizer and trace-source differences prevent treating every row as a one-variable ablation.
The final RL stage changes the comparison again. In the matched 28,419-prompt study, baseline ends at 37.86% pass@1 and 54.80% pass@16. Chronological trace-only training ends at 38.49% and 53.85%. Direct PT continuation ends at 36.36% and 54.26%. Continuing RL weights through PT plus all traces with fresh AdamW ends at 38.01% and 54.59%.
Across the fifteen alternatives to baseline, none of the final pass@1/pass@16 differences excludes zero after adjustment for the thirty comparisons. That is not proof of equivalence. It means this evaluation does not establish a final improvement among those alternatives. All sixteen experiments, including the optimizer and replay variants, are retained in the appendix.
Second chess study: full data and disjoint RL stages
The later study uses 64 prompts and 16 samples per prompt. It focuses on trace-only training and PT mixed with traces, with the intermediate stages continuing from RL weights and using fresh AdamW.
We compare two data schedules. In full/full, both RL stages use the full set of 53,156 eligible prompts. In A/B, the first stage uses A and the second uses B. Each contains 26,578 prompts, and their canonical position groups are disjoint.
The A/B experiments examine whether the recipes behave differently when final RL trains on a separate subset rather than returning to the same pool. They do not by themselves isolate the effect of traces: the study does not include every possible no-trace A/B control. We also do not attribute differences between the two chess studies to rollout geometry alone, because training data and some initialization choices changed as well.
The middle-stage improvement is not the final outcome
For the full/full PT-plus-trace experiment, the first RL checkpoint has PT loss 0.536972, pass@1 29.17%, and pass@16 52.43%. After PT plus traces, these become 0.509888, 30.24%, and 59.12%. Here the middle stage improves all three observed metrics relative to its own RL parent.
Relative to the ordinary 5B PT baseline, the same checkpoint has lower PT loss, higher pass@1, and higher pass@16. That is a useful intermediate result. It does not isolate a benefit from RL itself: the earlier split-PT control has lower PT loss, and trace training adds supervised work.
Final RL increases this run’s pass@1 to 36.09%, raises PT loss to 0.520700, and leaves pass@16 nearly unchanged at 59.05%. The appropriate final comparison is now the conventional PT → RL baseline:
| Checkpoint | PT loss ↓ | Pass@1 (%) | Pass@2 (%) | Pass@4 (%) | Pass@8 (%) | Pass@16 (%) |
|---|---|---|---|---|---|---|
| Baseline | 0.534776 | 38.19 | 44.33 | 49.56 | 54.37 | 58.58 |
| Trace-only · A/B | 0.542875 | 38.63 | 44.73 | 49.75 | 54.30 | 58.58 |
| Trace-only · full/full | 0.543711 | 38.20 | 44.32 | 49.43 | 53.87 | 57.77 |
| PT + traces · A/B | 0.522745 | 36.16 | 42.52 | 47.91 | 52.64 | 56.96 |
| PT + traces · full/full | 0.520700 | 36.09 | 42.56 | 48.32 | 53.74 | 59.05 |
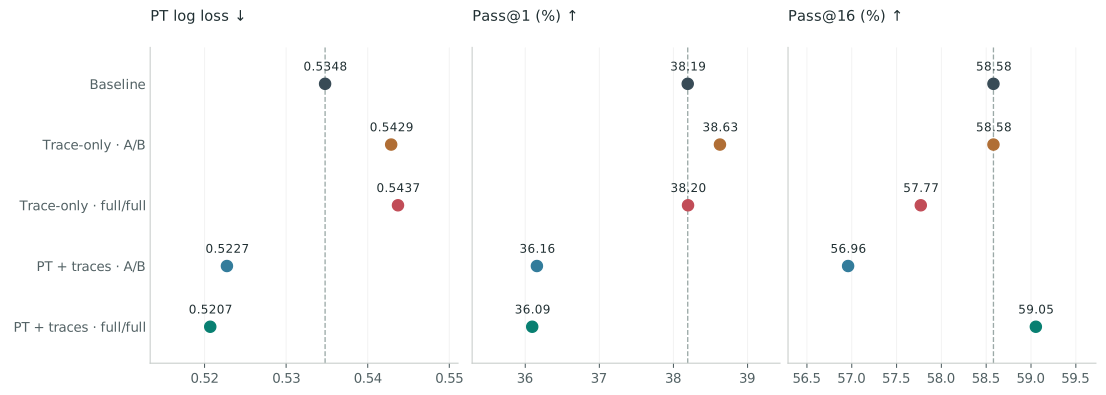
The trace-only variants finish close to baseline at pass@1, with higher PT loss. PT plus traces finishes with lower PT loss but about two percentage points lower pass@1. Its pass@16 outcome depends on the data schedule: 56.96% for A/B and 59.05% for full/full, compared with 58.58% for baseline.
For the full/full PT-plus-trace run, the pass@1 difference is −2.10 points, with a multiplicity-adjusted paired-bootstrap interval of [−3.78, −0.39]. The pass@16 difference is +0.47 points, with an adjusted interval of [−2.40, +3.24]. The saved evaluation supports a pass@1 deficit; it does not establish a pass@16 improvement.
The two data schedules therefore do not produce a consistent final advantage from interleaving. They do reinforce the distinction between lower PT loss and better task performance.
Math: testing the main pattern in another domain
We use the completed math experiments to ask whether these tradeoffs extend beyond chess. The comparison has three approaches: a 45B PT baseline followed by RL, PT plus traces between RL stages, and direct PT continuation from RL weights.
For math PT plus traces, the middle stage restarts from PT1 weights and incorporates RL-generated traces. Direct continuation starts from RL1 weights. Both selected variants use fresh AdamW at stage boundaries. We keep these initialization choices explicit when interpreting the results.
Before final RL, the results are:
| Approach | PT loss ↓ | Pass@1 (%) | Pass@2 (%) | Pass@4 (%) | Pass@8 (%) | Pass@16 (%) |
|---|---|---|---|---|---|---|
| Baseline | 1.227608 | 9.28 | 15.08 | 22.82 | 32.05 | 42.20 |
| PT + traces | 1.234848 | 16.83 | 24.99 | 34.09 | 43.44 | 52.60 |
| Direct continuation | 1.235861 | 10.25 | 16.50 | 24.45 | 33.52 | 43.20 |
PT plus traces has substantially higher intermediate SkyEasy success than the ordinary PT checkpoint. Direct continuation is closer to baseline. Both have slightly higher PT loss than baseline, so the observed task gains do not amount to an improvement in the pretraining objective.
After final RL:
| Approach | PT loss ↓ | Pass@1 (%) | Pass@2 (%) | Pass@4 (%) | Pass@8 (%) | Pass@16 (%) |
|---|---|---|---|---|---|---|
| Baseline | 1.240630 | 28.94 | 38.03 | 46.90 | 55.55 | 64.20 |
| PT + traces | 1.238009 | 24.89 | 34.39 | 43.76 | 52.72 | 61.60 |
| Direct continuation | 1.242338 | 24.36 | 33.66 | 43.57 | 53.37 | 62.20 |
The conventional baseline finishes above both interleaved approaches at all five displayed SkyEasy pass@k values. The same direction appears in the additional greedy benchmarks:
| Approach | Numina response loss ↓ | GSM8K greedy (%) | MATH greedy (%) |
|---|---|---|---|
| Baseline | 0.616258 | 42.53 | 31.34 |
| PT + traces | 0.591252 | 31.31 | 28.98 |
| Direct continuation | 0.603771 | 35.63 | 28.52 |
PT plus traces has lower final PT loss and lower held-out Numina response loss than baseline, but lower final task accuracy. The direct-continuation run also finishes below baseline on task performance. These are observed endpoint differences; we do not attach training-seed uncertainty to them.
The math comparison tests the main approaches without reproducing the full chess ablation matrix. These results show that intermediate gains do not necessarily translate into stronger final RL performance in a second domain. The absence of a matched no-RL split-PT control limits what we can attribute specifically to intervening RL.
What the experiments tell us
First, returning to supervised training can change which metric looks better. Direct PT continuation can improve loss and high-k success while reducing single-attempt success. Calling that entire transition a “washout” would hide part of the result.
Second, traces can improve the intermediate model without delivering a better final model. We see useful intermediate pass@k results from trace training, including when training continues from RL weights. The full PT → RL endpoint remains the comparison that answers whether the recipe improves final performance.
Third, lower PT loss is a real measured outcome, but it is not sufficient evidence for the broader recipe. In the later chess study and the math PT-plus-trace run, lower final PT loss coexists with lower final pass@1. Before final RL, the no-RL PT controls also challenge the claim that inserting RL itself improves pretraining.
Our conclusion is bounded by the experiments: the interleaving recipes tested here do not provide a consistent improvement over ordinary PT followed by RL. They reveal tradeoffs between the objectives and between single-attempt and multiple-attempt success. Establishing a mechanism for those tradeoffs would require evidence beyond these endpoint metrics.
Evaluation and limits
Chess evaluates 1,480 held-out puzzles with sixteen samples each, temperature 1 and top-p 1, using a 2,048-token context with a 512-token prompt cap and a 1,536-model-token response budget. Four overlength puzzles from the original 1,484 are excluded by the frozen admission rule. PT loss is token cross-entropy on 8,388,608 held-out targets.
For c successful samples out of n = 16, we calculate pass@k per problem as 1 − C(n−c,k) / C(n,k), then average across problems. Pass@16 is success within the saved sixteen attempts; it is not a measure of unlimited capability or a direct diversity metric.
Math SkyEasy evaluation uses 500 held-out questions and sixteen samples per question at temperature 1 and top-p 1, with native context 4,096. GSM8K and MATH results use separate greedy evaluations on 1,319 and 5,000 questions. Numina response loss uses 100 held-out questions with prompt tokens masked. PT loss aggregates the saved held-out PT components; its numerical scale is not comparable with chess loss.
The chess final comparisons use 20,000 paired bootstrap replicates over puzzle identities. The reported adjusted intervals account for eight contrasts in the later study and thirty in the earlier study. These intervals are conditional on the trained checkpoints and saved generations. They do not include independent training-seed variation. We do not report corresponding intervals for the intermediate comparisons or math results here, or population confidence intervals for PT loss.
All results here come from saved evaluations. The chess analysis uses the corrected evaluation lineage and preserves data-matched final endpoints. Experiments differ in trace data, learning-rate schedules, optimizer handling, and sometimes RL data; these are comparisons of specified training recipes, not a complete causal decomposition. Total FLOPs are not matched. Missing controls limit the claims but do not prevent reporting the completed results.
Complete results
The tables below retain every saved chess stage in the two studies, including the A/B variants and additional final-RL dataset variants. Main-text comparisons use final checkpoints matched to their study’s baseline. Values are rounded for display; the source files retain full precision.
Earlier chess: all 16 experiments, before and after final RL
| Checkpoint | PT loss ↓ | Pass@1 (%) | Pass@2 (%) | Pass@4 (%) | Pass@8 (%) | Pass@16 (%) |
|---|---|---|---|---|---|---|
| Baseline: one 5B PT schedule · before final RL | 0.512429 | 19.11 | 29.06 | 39.58 | 49.21 | 57.30 |
| Baseline: one 5B PT schedule · after final RL | 0.532375 | 37.86 | 43.04 | 47.35 | 51.18 | 54.80 |
| Control: two 2.5B PT schedules · before final RL | 0.507432 | 18.23 | 28.09 | 38.71 | 48.62 | 57.43 |
| Control: two 2.5B PT schedules · after final RL | 0.523177 | 37.94 | 43.18 | 47.76 | 52.03 | 55.88 |
| Trace-only, shuffled · before final RL | 0.537043 | 36.11 | 42.59 | 48.03 | 52.99 | 58.04 |
| Trace-only, shuffled · after final RL | 0.546173 | 37.64 | 42.69 | 46.90 | 50.42 | 53.51 |
| Trace-only, chronological · before final RL | 0.546131 | 37.70 | 43.32 | 47.97 | 52.03 | 55.88 |
| Trace-only, chronological · after final RL | 0.554020 | 38.49 | 43.36 | 47.43 | 50.91 | 53.85 |
| Shuffled traces → PT2 · before final RL | 0.507357 | 17.72 | 27.55 | 38.23 | 47.95 | 56.01 |
| Shuffled traces → PT2 · after final RL | 0.518310 | 36.61 | 42.34 | 47.23 | 51.63 | 55.74 |
| Chronological traces → PT2 · before final RL | 0.507585 | 17.82 | 27.58 | 38.26 | 48.25 | 56.89 |
| Chronological traces → PT2 · after final RL | 0.517506 | 36.63 | 42.22 | 46.78 | 50.83 | 54.86 |
| PT2 + traces, stable mixing · before final RL | 0.510979 | 33.50 | 40.03 | 45.52 | 50.45 | 55.00 |
| PT2 + traces, stable mixing · after final RL | 0.520220 | 37.14 | 42.12 | 46.51 | 50.56 | 54.26 |
| PT2 + traces, global shuffle · before final RL | 0.509731 | 32.57 | 39.48 | 45.39 | 50.69 | 55.27 |
| PT2 + traces, global shuffle · after final RL | 0.519042 | 36.46 | 41.21 | 45.40 | 49.32 | 53.38 |
| RL weights → PT2, fresh AdamW · before final RL | 0.507826 | 17.85 | 27.68 | 38.27 | 47.86 | 55.68 |
| RL weights → PT2, fresh AdamW · after final RL | 0.519173 | 36.36 | 42.15 | 46.98 | 50.94 | 54.26 |
| RL weights → PT2 + late trace replay · before final RL | 0.508571 | 26.34 | 35.72 | 43.99 | 51.20 | 57.84 |
| RL weights → PT2 + late trace replay · after final RL | 0.519834 | 36.59 | 41.77 | 45.96 | 49.66 | 53.24 |
| RL weights → PT2, carry AdamW · before final RL | 0.507727 | 18.11 | 27.98 | 38.53 | 48.07 | 56.49 |
| RL weights → PT2, carry AdamW · after final RL | 0.520721 | 36.90 | 42.27 | 47.10 | 51.50 | 55.20 |
| RL weights → PT2 + late replay, carry AdamW · before final RL | 0.507952 | 26.22 | 35.80 | 44.13 | 51.45 | 58.18 |
| RL weights → PT2 + late replay, carry AdamW · after final RL | 0.519272 | 36.93 | 41.69 | 45.71 | 49.34 | 52.84 |
| PT weights + PT AdamW → PT2 + traces, ordered · before final RL | 0.511257 | 33.56 | 40.14 | 45.71 | 50.49 | 54.66 |
| PT weights + PT AdamW → PT2 + traces, ordered · after final RL | 0.520507 | 37.53 | 42.41 | 46.49 | 49.79 | 52.43 |
| PT weights + PT AdamW → PT2 + traces, shuffled · before final RL | 0.510219 | 32.81 | 39.59 | 45.35 | 50.63 | 55.81 |
| PT weights + PT AdamW → PT2 + traces, shuffled · after final RL | 0.518676 | 37.11 | 42.04 | 46.13 | 49.61 | 52.77 |
| RL weights + RL AdamW → PT2 + all traces · before final RL | 0.511704 | 34.08 | 40.40 | 45.72 | 50.67 | 55.61 |
| RL weights + RL AdamW → PT2 + all traces · after final RL | 0.521367 | 37.62 | 42.58 | 46.74 | 50.36 | 53.51 |
| RL weights + fresh AdamW → PT2 + all traces · before final RL | 0.510470 | 34.04 | 40.55 | 45.99 | 50.95 | 55.41 |
| RL weights + fresh AdamW → PT2 + all traces · after final RL | 0.520661 | 38.01 | 42.94 | 47.04 | 50.84 | 54.59 |
Later chess: all five experiments, before and after final RL
| Checkpoint | PT loss ↓ | Pass@1 (%) | Pass@2 (%) | Pass@4 (%) | Pass@8 (%) | Pass@16 (%) |
|---|---|---|---|---|---|---|
| Baseline / full · before final RL | 0.512429 | 19.11 | 29.06 | 39.58 | 49.21 | 57.30 |
| Baseline / full · after final RL | 0.534776 | 38.19 | 44.33 | 49.56 | 54.37 | 58.58 |
| Trace-only / A→B · before final RL | 0.538013 | 36.79 | 43.46 | 49.12 | 54.20 | 58.78 |
| Trace-only / A→B · after final RL | 0.542875 | 38.63 | 44.73 | 49.75 | 54.30 | 58.58 |
| Trace-only / full→full · before final RL | 0.535673 | 36.59 | 43.79 | 49.64 | 54.61 | 59.05 |
| Trace-only / full→full · after final RL | 0.543711 | 38.20 | 44.32 | 49.43 | 53.87 | 57.77 |
| PT + traces / A→B · before final RL | 0.509955 | 29.47 | 38.18 | 45.90 | 52.80 | 59.05 |
| PT + traces / A→B · after final RL | 0.522745 | 36.16 | 42.52 | 47.91 | 52.64 | 56.96 |
| PT + traces / full→full · before final RL | 0.509888 | 30.24 | 39.10 | 46.80 | 53.40 | 59.12 |
| PT + traces / full→full · after final RL | 0.520700 | 36.09 | 42.56 | 48.32 | 53.74 | 59.05 |
Earlier chess: six additional final endpoints on the larger RL set
These endpoints use 53,225 RL training prompts and are not substituted for the 28,419-prompt main comparison.
| Checkpoint | PT loss ↓ | Pass@1 (%) | Pass@2 (%) | Pass@4 (%) | Pass@8 (%) | Pass@16 (%) |
|---|---|---|---|---|---|---|
| rl11_final · 53,225 RL prompts | 0.520187 | 36.80 | 43.68 | 49.47 | 54.64 | 59.59 |
| rl12_final · 53,225 RL prompts | 0.518223 | 37.39 | 43.10 | 48.09 | 52.65 | 56.76 |
| rl13_final · 53,225 RL prompts | 0.519089 | 37.82 | 43.15 | 47.64 | 51.62 | 55.61 |
| rl14_final · 53,225 RL prompts | 0.519770 | 37.96 | 43.29 | 47.95 | 52.17 | 55.95 |
| rl15_final · 53,225 RL prompts | 0.521709 | 38.81 | 44.09 | 48.47 | 52.29 | 55.68 |
| rl16_final · 53,225 RL prompts | 0.518890 | 38.04 | 43.33 | 47.82 | 51.93 | 55.95 |
Every saved 256x8 chess checkpoint · full pass@1–16
| Checkpoint | PT loss ↓ | Pass@1 (%) | Pass@2 (%) | Pass@3 (%) | Pass@4 (%) | Pass@5 (%) | Pass@6 (%) | Pass@7 (%) | Pass@8 (%) | Pass@9 (%) | Pass@10 (%) | Pass@11 (%) | Pass@12 (%) | Pass@13 (%) | Pass@14 (%) | Pass@15 (%) | Pass@16 (%) |
|---|---|---|---|---|---|---|---|---|---|---|---|---|---|---|---|---|---|
| pt5b_sft3_full | 0.512429 | 19.11 | 29.06 | 35.26 | 39.58 | 42.83 | 45.39 | 47.47 | 49.21 | 50.70 | 51.98 | 53.12 | 54.12 | 55.03 | 55.85 | 56.60 | 57.30 |
| pt2p5b_sft3_first | 0.525055 | 13.85 | 22.14 | 27.84 | 32.05 | 35.33 | 37.99 | 40.19 | 42.07 | 43.69 | 45.11 | 46.37 | 47.49 | 48.49 | 49.41 | 50.24 | 51.01 |
| pt2p5b_sft3_second_plain | 0.507432 | 18.23 | 28.09 | 34.33 | 38.71 | 42.01 | 44.64 | 46.80 | 48.62 | 50.19 | 51.58 | 52.80 | 53.91 | 54.91 | 55.82 | 56.66 | 57.43 |
| rl_pt5b_source | 0.527518 | 36.93 | 42.50 | 45.34 | 47.24 | 48.64 | 49.75 | 50.65 | 51.42 | 52.08 | 52.66 | 53.18 | 53.64 | 54.06 | 54.45 | 54.81 | 55.14 |
| rl_pt2p5b_source | 0.540289 | 30.79 | 36.39 | 39.32 | 41.26 | 42.71 | 43.85 | 44.80 | 45.60 | 46.30 | 46.91 | 47.46 | 47.95 | 48.40 | 48.81 | 49.18 | 49.53 |
| trace03_shuffled | 0.537043 | 36.11 | 42.59 | 45.86 | 48.03 | 49.66 | 50.96 | 52.05 | 52.99 | 53.83 | 54.58 | 55.27 | 55.90 | 56.49 | 57.04 | 57.55 | 58.04 |
| trace04_chronological | 0.546131 | 37.70 | 43.32 | 46.13 | 47.97 | 49.33 | 50.40 | 51.28 | 52.03 | 52.69 | 53.27 | 53.80 | 54.28 | 54.72 | 55.13 | 55.52 | 55.88 |
| trace05_shuffled | 0.552901 | 30.27 | 36.64 | 40.01 | 42.27 | 43.94 | 45.24 | 46.31 | 47.20 | 47.97 | 48.63 | 49.23 | 49.76 | 50.24 | 50.68 | 51.10 | 51.49 |
| trace06_chronological | 0.560367 | 30.74 | 36.10 | 38.93 | 40.84 | 42.30 | 43.47 | 44.45 | 45.30 | 46.05 | 46.72 | 47.32 | 47.87 | 48.37 | 48.84 | 49.27 | 49.66 |
| trace05_then_pt_second | 0.507357 | 17.72 | 27.55 | 33.83 | 38.23 | 41.52 | 44.10 | 46.20 | 47.95 | 49.45 | 50.74 | 51.87 | 52.88 | 53.78 | 54.60 | 55.34 | 56.01 |
| trace06_then_pt_second | 0.507585 | 17.82 | 27.58 | 33.84 | 38.26 | 41.61 | 44.26 | 46.43 | 48.25 | 49.82 | 51.18 | 52.39 | 53.47 | 54.45 | 55.33 | 56.14 | 56.89 |
| trace07_mixed_pt_second | 0.510979 | 33.50 | 40.03 | 43.33 | 45.52 | 47.16 | 48.45 | 49.53 | 50.45 | 51.24 | 51.95 | 52.58 | 53.16 | 53.68 | 54.15 | 54.59 | 55.00 |
| trace08_global_shuffle_pt_second | 0.509731 | 32.57 | 39.48 | 43.02 | 45.39 | 47.16 | 48.56 | 49.72 | 50.69 | 51.52 | 52.25 | 52.89 | 53.47 | 53.98 | 54.45 | 54.88 | 55.27 |
| rl01_final | 0.532375 | 37.86 | 43.04 | 45.63 | 47.35 | 48.63 | 49.64 | 50.47 | 51.18 | 51.80 | 52.35 | 52.84 | 53.29 | 53.71 | 54.09 | 54.46 | 54.80 |
| rl02_final | 0.523177 | 37.94 | 43.18 | 45.90 | 47.76 | 49.16 | 50.29 | 51.23 | 52.03 | 52.72 | 53.32 | 53.86 | 54.35 | 54.78 | 55.18 | 55.54 | 55.88 |
| rl03_final | 0.546173 | 37.64 | 42.69 | 45.24 | 46.90 | 48.10 | 49.03 | 49.79 | 50.42 | 50.97 | 51.46 | 51.89 | 52.27 | 52.62 | 52.94 | 53.24 | 53.51 |
| rl04_final | 0.554020 | 38.49 | 43.36 | 45.83 | 47.43 | 48.61 | 49.53 | 50.28 | 50.91 | 51.45 | 51.92 | 52.33 | 52.70 | 53.03 | 53.32 | 53.60 | 53.85 |
| rl05_final | 0.518310 | 36.61 | 42.34 | 45.27 | 47.23 | 48.69 | 49.85 | 50.81 | 51.63 | 52.34 | 52.97 | 53.53 | 54.05 | 54.52 | 54.96 | 55.36 | 55.74 |
| rl06_final | 0.517506 | 36.63 | 42.22 | 44.98 | 46.78 | 48.11 | 49.17 | 50.06 | 50.83 | 51.52 | 52.13 | 52.69 | 53.20 | 53.67 | 54.10 | 54.50 | 54.86 |
| rl07_final | 0.520220 | 37.14 | 42.12 | 44.74 | 46.51 | 47.85 | 48.92 | 49.81 | 50.56 | 51.22 | 51.80 | 52.31 | 52.77 | 53.19 | 53.58 | 53.93 | 54.26 |
| rl08_final | 0.519042 | 36.46 | 41.21 | 43.72 | 45.40 | 46.68 | 47.70 | 48.57 | 49.32 | 49.99 | 50.59 | 51.14 | 51.65 | 52.13 | 52.57 | 52.99 | 53.38 |
| trace09_direct_rl_then_pt_second_v3 | 0.507826 | 17.85 | 27.68 | 33.91 | 38.27 | 41.53 | 44.08 | 46.14 | 47.86 | 49.32 | 50.58 | 51.68 | 52.65 | 53.53 | 54.31 | 55.03 | 55.68 |
| trace10_direct_rl_then_pt_replay_second_v2 | 0.508571 | 26.34 | 35.72 | 40.71 | 43.99 | 46.40 | 48.30 | 49.87 | 51.20 | 52.36 | 53.40 | 54.32 | 55.16 | 55.92 | 56.61 | 57.25 | 57.84 |
| rl11_12_shared_continuous | 0.539732 | 31.53 | 36.98 | 39.85 | 41.79 | 43.24 | 44.39 | 45.33 | 46.12 | 46.80 | 47.41 | 47.94 | 48.43 | 48.88 | 49.30 | 49.70 | 50.07 |
| trace11_continuous_then_pt_second | 0.507727 | 18.11 | 27.98 | 34.20 | 38.53 | 41.75 | 44.28 | 46.34 | 48.07 | 49.56 | 50.87 | 52.03 | 53.08 | 54.04 | 54.92 | 55.73 | 56.49 |
| trace12_continuous_then_pt_replay_second | 0.507952 | 26.22 | 35.80 | 40.84 | 44.13 | 46.56 | 48.48 | 50.09 | 51.45 | 52.64 | 53.69 | 54.63 | 55.48 | 56.24 | 56.94 | 57.58 | 58.18 |
| rl09_final | 0.519173 | 36.36 | 42.15 | 45.09 | 46.98 | 48.34 | 49.39 | 50.24 | 50.94 | 51.54 | 52.06 | 52.52 | 52.93 | 53.31 | 53.65 | 53.97 | 54.26 |
| rl10_final | 0.519834 | 36.59 | 41.77 | 44.32 | 45.96 | 47.18 | 48.16 | 48.96 | 49.66 | 50.27 | 50.81 | 51.30 | 51.75 | 52.17 | 52.55 | 52.91 | 53.24 |
| rl11_final | 0.520187 | 36.80 | 43.68 | 47.17 | 49.47 | 51.18 | 52.53 | 53.67 | 54.64 | 55.49 | 56.25 | 56.94 | 57.56 | 58.13 | 58.66 | 59.14 | 59.59 |
| rl12_final | 0.518223 | 37.39 | 43.10 | 46.08 | 48.09 | 49.61 | 50.81 | 51.81 | 52.65 | 53.38 | 54.03 | 54.60 | 55.11 | 55.58 | 56.00 | 56.39 | 56.76 |
| trace13_pt1_adam_ordered_pt_second | 0.511257 | 33.56 | 40.14 | 43.49 | 45.71 | 47.34 | 48.61 | 49.63 | 50.49 | 51.23 | 51.88 | 52.45 | 52.97 | 53.44 | 53.88 | 54.29 | 54.66 |
| trace14_pt1_adam_global_pt_second | 0.510219 | 32.81 | 39.59 | 43.05 | 45.35 | 47.09 | 48.48 | 49.63 | 50.63 | 51.50 | 52.28 | 52.98 | 53.63 | 54.23 | 54.79 | 55.31 | 55.81 |
| rl13_final | 0.519089 | 37.82 | 43.15 | 45.85 | 47.64 | 48.96 | 50.01 | 50.88 | 51.62 | 52.29 | 52.88 | 53.42 | 53.92 | 54.38 | 54.82 | 55.22 | 55.61 |
| rl14_final | 0.519770 | 37.96 | 43.29 | 46.07 | 47.95 | 49.35 | 50.47 | 51.39 | 52.17 | 52.85 | 53.44 | 53.97 | 54.44 | 54.87 | 55.26 | 55.62 | 55.95 |
| trace15_direct_rl_all_trace_ordered_continue_adam_pt_second | 0.511704 | 34.08 | 40.40 | 43.58 | 45.72 | 47.33 | 48.64 | 49.73 | 50.67 | 51.50 | 52.25 | 52.93 | 53.55 | 54.12 | 54.65 | 55.15 | 55.61 |
| trace16_direct_rl_all_trace_ordered_fresh_adam_pt_second | 0.510470 | 34.04 | 40.55 | 43.81 | 45.99 | 47.63 | 48.94 | 50.03 | 50.95 | 51.75 | 52.46 | 53.08 | 53.63 | 54.14 | 54.60 | 55.02 | 55.41 |
| rl15_final | 0.521709 | 38.81 | 44.09 | 46.74 | 48.47 | 49.75 | 50.75 | 51.58 | 52.29 | 52.90 | 53.43 | 53.90 | 54.33 | 54.71 | 55.05 | 55.38 | 55.68 |
| rl16_final | 0.518890 | 38.04 | 43.33 | 46.02 | 47.82 | 49.17 | 50.25 | 51.15 | 51.93 | 52.62 | 53.23 | 53.78 | 54.28 | 54.74 | 55.17 | 55.57 | 55.95 |
| rl11_final_prompts28419 | 0.520721 | 36.90 | 42.27 | 45.15 | 47.10 | 48.57 | 49.74 | 50.69 | 51.50 | 52.18 | 52.78 | 53.31 | 53.77 | 54.19 | 54.56 | 54.90 | 55.20 |
| rl12_final_prompts28419 | 0.519272 | 36.93 | 41.69 | 44.10 | 45.71 | 46.91 | 47.86 | 48.66 | 49.34 | 49.94 | 50.48 | 50.96 | 51.41 | 51.81 | 52.18 | 52.52 | 52.84 |
| rl13_final_prompts28419 | 0.520507 | 37.53 | 42.41 | 44.89 | 46.49 | 47.64 | 48.51 | 49.21 | 49.79 | 50.28 | 50.70 | 51.07 | 51.40 | 51.70 | 51.97 | 52.21 | 52.43 |
| rl14_final_prompts28419 | 0.518676 | 37.11 | 42.04 | 44.52 | 46.13 | 47.30 | 48.22 | 48.97 | 49.61 | 50.16 | 50.65 | 51.09 | 51.49 | 51.85 | 52.18 | 52.49 | 52.77 |
| rl15_final_prompts28419 | 0.521367 | 37.62 | 42.58 | 45.09 | 46.74 | 47.96 | 48.91 | 49.70 | 50.36 | 50.94 | 51.44 | 51.88 | 52.28 | 52.63 | 52.95 | 53.25 | 53.51 |
| rl16_final_prompts28419 | 0.520661 | 38.01 | 42.94 | 45.40 | 47.04 | 48.28 | 49.28 | 50.11 | 50.84 | 51.47 | 52.04 | 52.56 | 53.03 | 53.47 | 53.87 | 54.25 | 54.59 |
Every saved 64x16 chess checkpoint · full pass@1–16
| Checkpoint | PT loss ↓ | Pass@1 (%) | Pass@2 (%) | Pass@3 (%) | Pass@4 (%) | Pass@5 (%) | Pass@6 (%) | Pass@7 (%) | Pass@8 (%) | Pass@9 (%) | Pass@10 (%) | Pass@11 (%) | Pass@12 (%) | Pass@13 (%) | Pass@14 (%) | Pass@15 (%) | Pass@16 (%) |
|---|---|---|---|---|---|---|---|---|---|---|---|---|---|---|---|---|---|
| pt5b_sft3_full | 0.512429 | 19.11 | 29.06 | 35.26 | 39.58 | 42.83 | 45.39 | 47.47 | 49.21 | 50.70 | 51.98 | 53.12 | 54.12 | 55.03 | 55.85 | 56.60 | 57.30 |
| pt2p5b_sft3_first | 0.525055 | 13.85 | 22.14 | 27.84 | 32.05 | 35.33 | 37.99 | 40.19 | 42.07 | 43.69 | 45.11 | 46.37 | 47.49 | 48.49 | 49.41 | 50.24 | 51.01 |
| r64_e01_rl3000_full | 0.534776 | 38.19 | 44.33 | 47.46 | 49.56 | 51.15 | 52.42 | 53.47 | 54.37 | 55.14 | 55.81 | 56.41 | 56.94 | 57.42 | 57.84 | 58.23 | 58.58 |
| r64_e02_rl1_a | 0.526597 | 36.20 | 43.11 | 46.70 | 49.11 | 50.92 | 52.36 | 53.55 | 54.55 | 55.43 | 56.20 | 56.89 | 57.52 | 58.09 | 58.63 | 59.13 | 59.59 |
| r64_e02_trace_chronological | 0.538013 | 36.79 | 43.46 | 46.86 | 49.12 | 50.81 | 52.15 | 53.26 | 54.20 | 55.01 | 55.73 | 56.36 | 56.94 | 57.46 | 57.94 | 58.38 | 58.78 |
| r64_e02_rl2_b | 0.542875 | 38.63 | 44.73 | 47.76 | 49.75 | 51.24 | 52.44 | 53.44 | 54.30 | 55.06 | 55.74 | 56.34 | 56.88 | 57.37 | 57.82 | 58.22 | 58.58 |
| r64_e03_rl1_full | 0.524071 | 36.24 | 43.72 | 47.51 | 50.00 | 51.85 | 53.31 | 54.52 | 55.56 | 56.46 | 57.26 | 57.98 | 58.63 | 59.22 | 59.77 | 60.27 | 60.74 |
| r64_e03_trace_chronological | 0.535673 | 36.59 | 43.79 | 47.35 | 49.64 | 51.32 | 52.63 | 53.70 | 54.61 | 55.40 | 56.09 | 56.71 | 57.27 | 57.77 | 58.24 | 58.66 | 59.05 |
| r64_e03_rl2_full | 0.543711 | 38.20 | 44.32 | 47.40 | 49.43 | 50.93 | 52.10 | 53.06 | 53.87 | 54.57 | 55.18 | 55.72 | 56.21 | 56.65 | 57.06 | 57.43 | 57.77 |
| r64_e04_rl1_a | 0.536907 | 28.75 | 35.52 | 39.26 | 41.83 | 43.76 | 45.30 | 46.57 | 47.66 | 48.61 | 49.45 | 50.21 | 50.90 | 51.53 | 52.12 | 52.66 | 53.18 |
| r64_e04_pt2_trace_mixed | 0.509955 | 29.47 | 38.18 | 42.81 | 45.90 | 48.20 | 50.03 | 51.53 | 52.80 | 53.90 | 54.87 | 55.74 | 56.52 | 57.23 | 57.89 | 58.49 | 59.05 |
| r64_e04_rl2_b | 0.522745 | 36.16 | 42.52 | 45.77 | 47.91 | 49.49 | 50.74 | 51.77 | 52.64 | 53.39 | 54.06 | 54.65 | 55.19 | 55.68 | 56.14 | 56.56 | 56.96 |
| r64_e05_rl1_full | 0.536972 | 29.17 | 36.15 | 39.87 | 42.36 | 44.21 | 45.66 | 46.85 | 47.84 | 48.68 | 49.42 | 50.06 | 50.63 | 51.15 | 51.61 | 52.04 | 52.43 |
| r64_e05_pt2_trace_mixed | 0.509888 | 30.24 | 39.10 | 43.74 | 46.80 | 49.04 | 50.79 | 52.21 | 53.40 | 54.42 | 55.31 | 56.11 | 56.82 | 57.47 | 58.06 | 58.61 | 59.12 |
| r64_e05_rl2_full | 0.520700 | 36.09 | 42.56 | 45.99 | 48.32 | 50.09 | 51.51 | 52.71 | 53.74 | 54.65 | 55.47 | 56.20 | 56.87 | 57.49 | 58.05 | 58.57 | 59.05 |
Data and results
The complete chess tables are included above. These downloads preserve the numerical results used in this post, including full pass@1–16 values and the final chess comparison intervals. Results reflect saved evaluations collected through September 10, 2026.